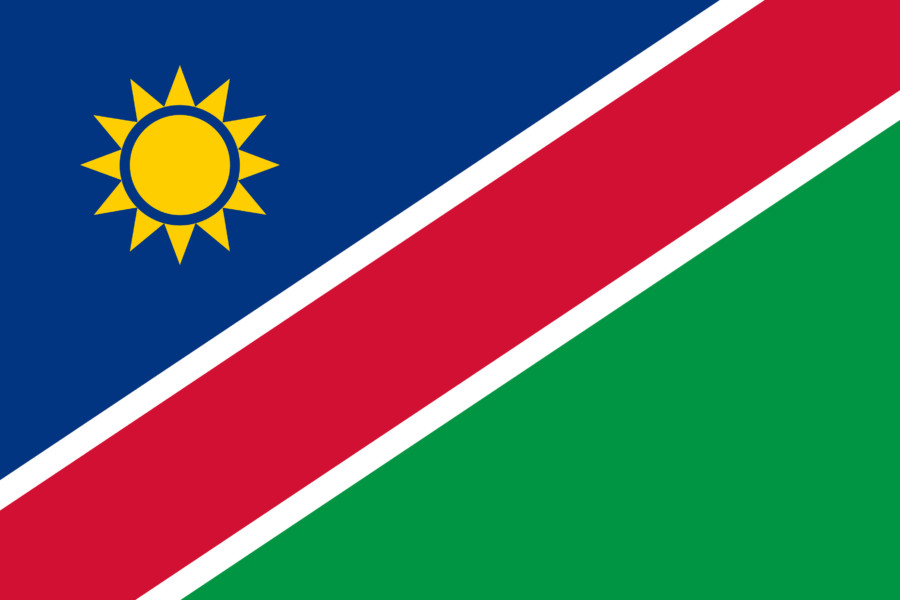
Namibia
Urban indicators:
| Value | Year | ||
| Surface area (sq km) | 824268 | 2014 | |
| Population (proj., 000) | 2514 | 2016 | |
| Pop. density (per sq km) | 3.1 | 2016 | |
| Capital city | Windhoek | 2015 | |
| Capital city pop. (000) | 368 | 2015 | |
| Population growth rate (average annual %) | 2.3 | 2010-2015 | |
| Urban population growth rate (average annual %) | 4.2 | 2010-2015 | |
| CO2 emission estimates (000 tons/tons per capita) | 2948/1.3 | 2013 | |
| Population using improved drinking water sources (urban/rural, %) | 98.2/84.7 | 2015 | |
| Population using improved sanitation facilities (urban/rural, %) | 54.5/16.8 | 2015 |
| 1995 | 2005 | 2014/2015 | |
| Urban population ('000) | 493 | 743 | 1,116 |
| Level of urbanization (%) | 29.8 | 36.6 | 46.7 |
| Proportion of urban population living in slum areas (%) | 34.1 | 33.9 | 39.4 |
| Urban Slum Population ('000) | 165 | 239 | 423 |
| Value | Year | |
| Urban Gini Coefficient | 0.63 | 1993i |
| Urban poverty headcount ratio based on national poverty lines | 14.6% | 2009 |
National Report:
National Report Executive Summary:
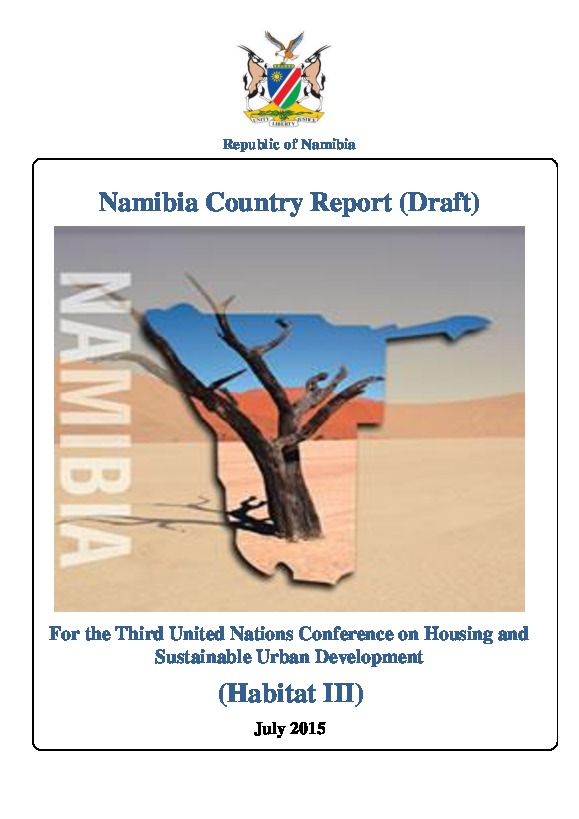
Namibia became independent in 1990. The first official census conducted in an independent Namibia during 1991 indicated that Namibia had a population of 1,409,915 people of whom 28% lived in the urban areas and 72% in the rural areas. Since this period, urban areas registered unprecedented growth, which in part reflected the freedom of movement enshrined in the Constitution after years of mobility restriction on people. The major factor promoting the rapid rate of urbanization in the country is rural-tourban migration, mainly of young men and women in search of better social and economic opportunities.1 Therefore, urban areas boast a greater formal workforce, which is a major driving force behind ruralurban migration and deepens rural-urban disparities. Namibian population increased to 1.8 million in 2001 to 2.1 million people in 2011, and the urban population grew by 49.7% whilst rural population dropped by 1.4% over the same period, a trend that illustrates high rates of rural-urban migration in the country (NSA, 2011:25-26).
With an increased rate of urbanisation, urban localities in Namibia are faced with a number of challenges such as growth of informal settlements, poor housing conditions, insecurity of tenure, unemployment, poor access to basic services and infrastructure, which give pressure to Local Authorities (LAs) to keep up with the demand for basic services and amenities.
Despite various strategies that are put in place, Namibian youth are still facing many challenges such as alcoholism, drug abuse, various health and social problems associated with HIV/AIDS and teenage pregnancies, crime and violence, physical and emotional abuse, high rates of school drop-outs, high unemployment levels, lack of or insufficient expertise and capital required to undertake entrepreneurial initiatives, lack of or inequitable access to information and recreational activities. All of this coupled with the detrimental impact of HIV/AIDS contribute towards an unhealthy environment for the youth of today and poor prospects for the future.
As urbanization causes more people to migrate to towns and cities, the elderly are left behind with little support and are left to fend for themselves. Other challenges faced by many elderly are the inadequacy of basic services, such as water and sanitation. Additionally, the elderly are forced to take care of their grandchildren due to various socio-economic situations.
Regardless of the progress made, there are still many challenges faced by women, such as increased prevalence of HIV/AIDS, rape and gender based violence. There is therefore a critical need to tackle all these ill issues of society.
Statistics:
Urban housing indicators
People living in slums (%)
Urban population with access to adequate housing (%)
Basic services and infrastructure
Urban population with access to safe drinking water (%)
Urban population with access to adequate sanitation (%)
Urban population with access to regular waste collection (%)
Statements by other countries on behalf of African Group and G77 and China:
-
Habitat III Plenaries
-
Intersessionals: Informal Intergovernmental Meetings (May 2016)
- Statement - 18 May (by Thailand) - English Made by Thailand on Behalf of G77 and China
- Statement – 18 May (by Nigeria, 1) - English Made by Nigeria on Behalf of African Group
- Statement - 18 May (by Jamaica) - English Made by Jamaica on Behalf of G77 and China
- Statement – 18 May (by Nigeria, 2) - English Made by Nigeria on Behalf of African Group
- Statement - 19 May (by Jamaica) - English Made by Jamaica on Behalf of G77 and China
- Statement – 19 May (by Nigeria, 1) - English Made by Nigeria on Behalf of African Group
- Statement - 19 May (by Kenya) - English Made by Kenya on Behalf of G77 and China
- Statement – 19 May (by Nigeria, 2) - English Made by Nigeria on Behalf of African Group
- Statement - 20 May (by Jamaica) - English Made by Jamaica on Behalf of G77 and China
- Statement – 20 May (by Nigeria, 1) - English Made by Nigeria on Behalf of African Group
- Statement - 20 May (by Thailand) - English Made by Thailand on Behalf of G77 and China
- Statement – 20 May (by Nigeria, 2) - English Made by Nigeria on Behalf of African Group

